Property Database
Rental properties for sale, analyzed against your goals
Portfolio Builder keeps its own database of for-sale single-family rental (SFR) and small multifamily properties in the top-ranked rental cities of major investable metros. Every listing gets researched numbers and the same institutional-grade investment analysis as the properties you bring yourself, so you can see which ones meet your returns before you call anyone.
We cover the most investable SFR markets
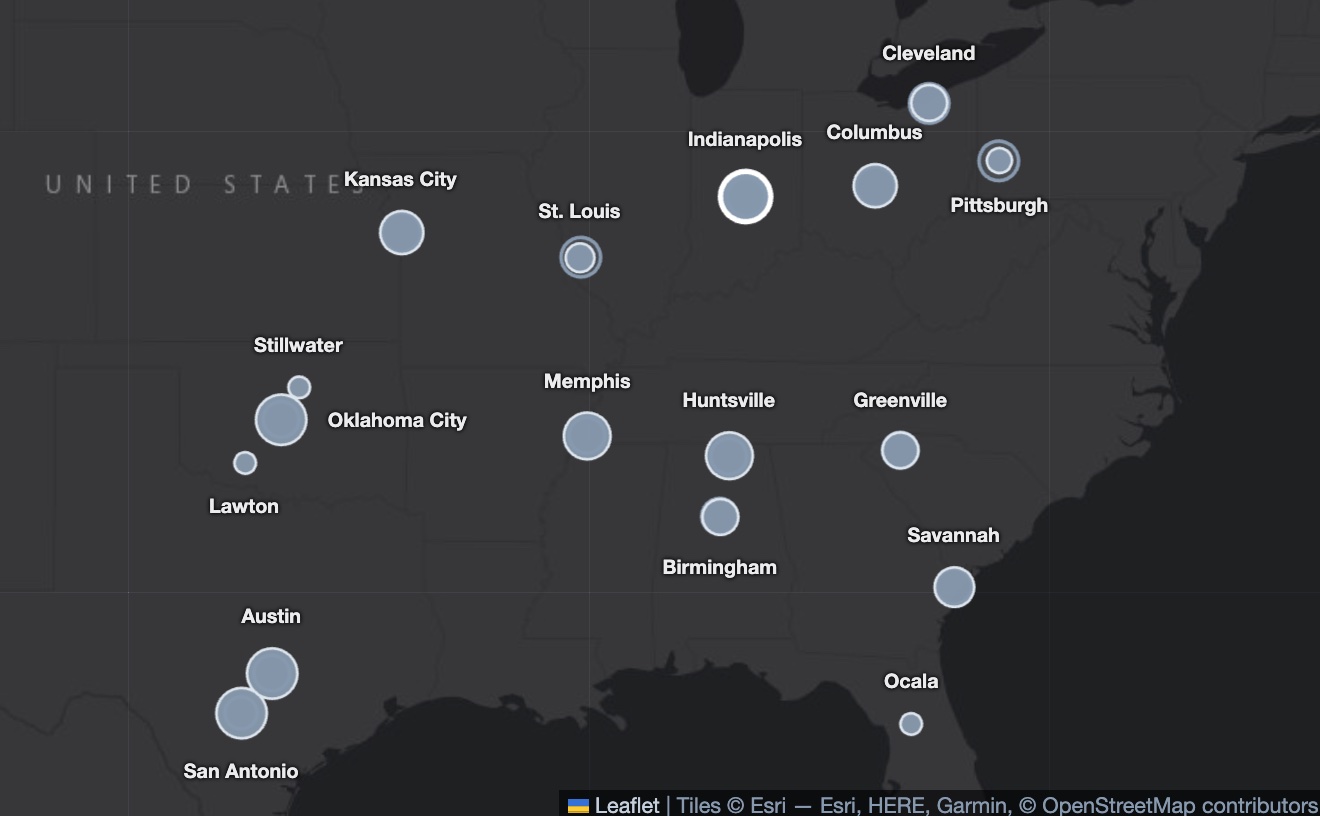
Live metros across the Midwest, the Southeast, Oklahoma, and Texas. More are added regularly.
- investable metros, more added regularly
- Major
- investable metros, more added regularly
- ranked rental cities per metro
- Top 10
- ranked rental cities per metro
- for-sale properties, already analyzed
- Thousands
- for-sale properties, already analyzed
Live metros include: Austin, TX · Birmingham, AL · Cleveland, OH · Columbus, OH · Greenville, SC · Huntsville, AL · Indianapolis, IN · Kansas City, MO–KS · Lawton, OK · Memphis, TN–MS · Ocala, FL · Oklahoma City, OK · Pittsburgh, PA · St. Louis, MO–IL · San Antonio, TX · Savannah, GA · Stillwater, OK
How a metro is built
Coverage is deliberate, not exhaustive: each metro is scanned, its cities are ranked, and only listings from the best rental cities are published.
- 1
Scan
Every active for-sale single-family, multifamily, townhouse, and condo listing priced $150k–$500k within 25 miles of the metro center, plus local rental listings, from licensed market data.
- 2
Rank the cities
A researched report ranks the metro's cities for long-term rental investing: cash flow, appreciation, and vacancy risk. Only cities with actual listings are ranked.
- 3
Publish the best
Listings in the top ten ranked cities are published if they pass basic quality rules, such as a minimum price and a believable rent-to-price ratio.
Researched numbers, not rules of thumb
A listing price alone can't tell you whether a property works. Our proprietary algorithms curate each property before you see it, filling in the rent, property tax, and insurance figures that decide whether a rental cash-flows.
Why it matters: generic percentages overstated insurance by 3–8× on newer homes, which made good deals look bad. New homes typically insure for 0.2–0.4% of value, not the 1.5–2% that older rules of thumb assume.
Search, map, import
Every listing is judged against your own Investment Goals (financing, minimum cap rate and cash-on-cash return, hold period) and gets the same INVEST, CAUTION, or REJECT verdict as your own properties.
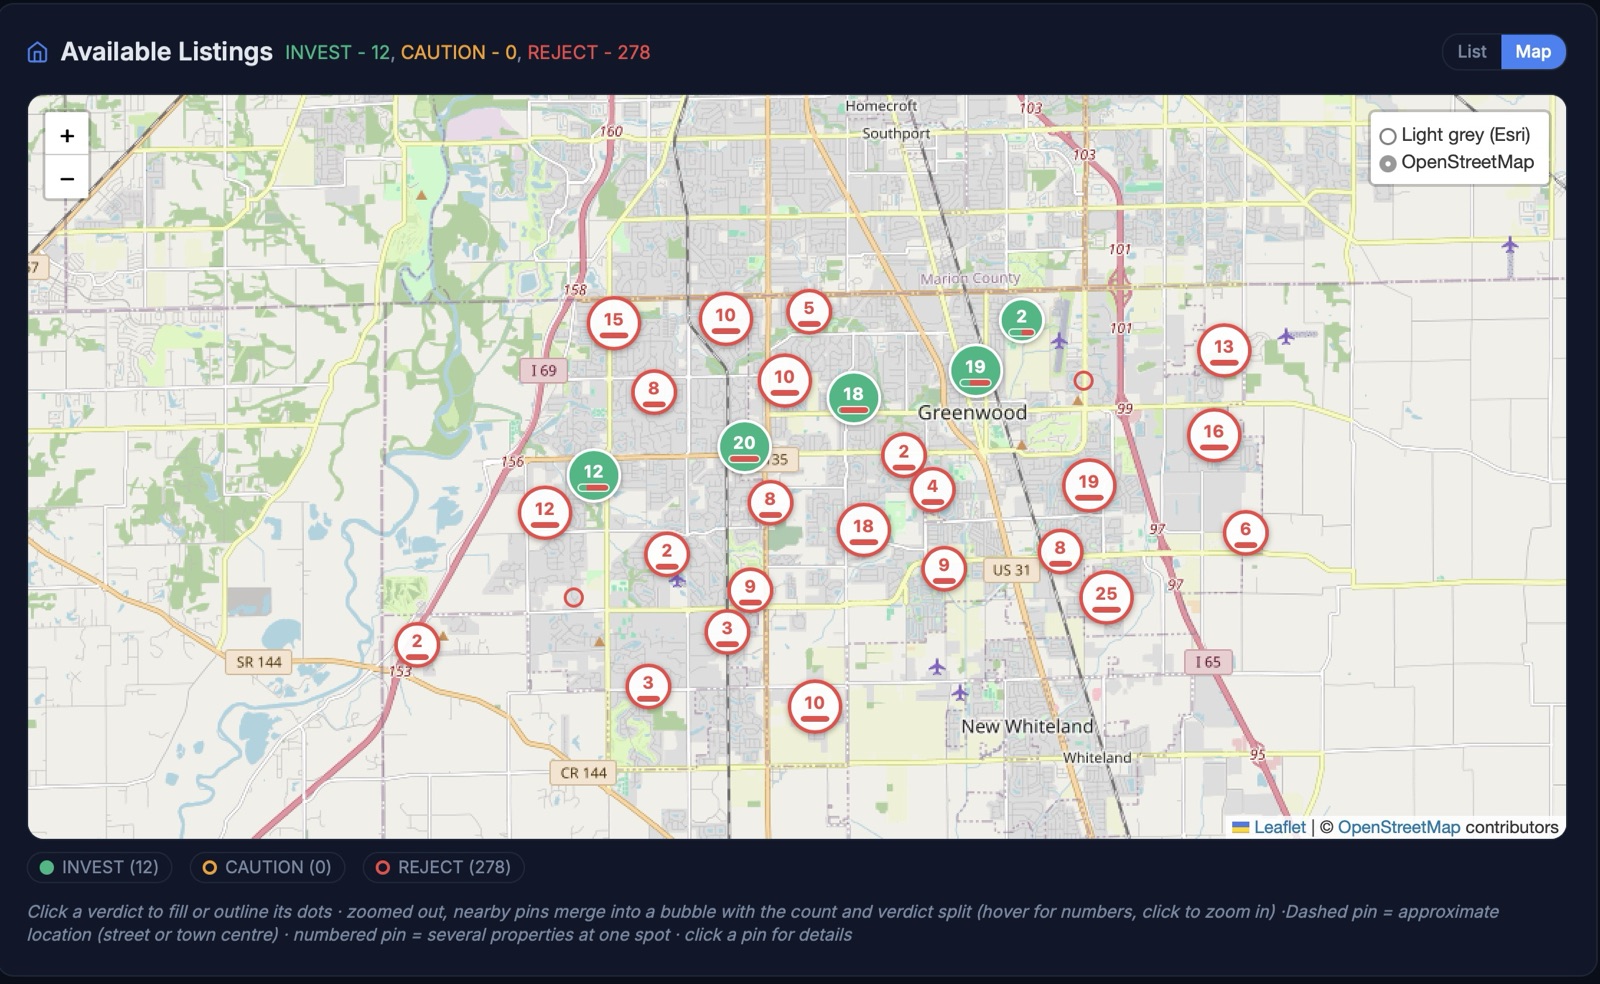
Finding the needle in a haystack. Greenwood, IN Oct 16, 2026
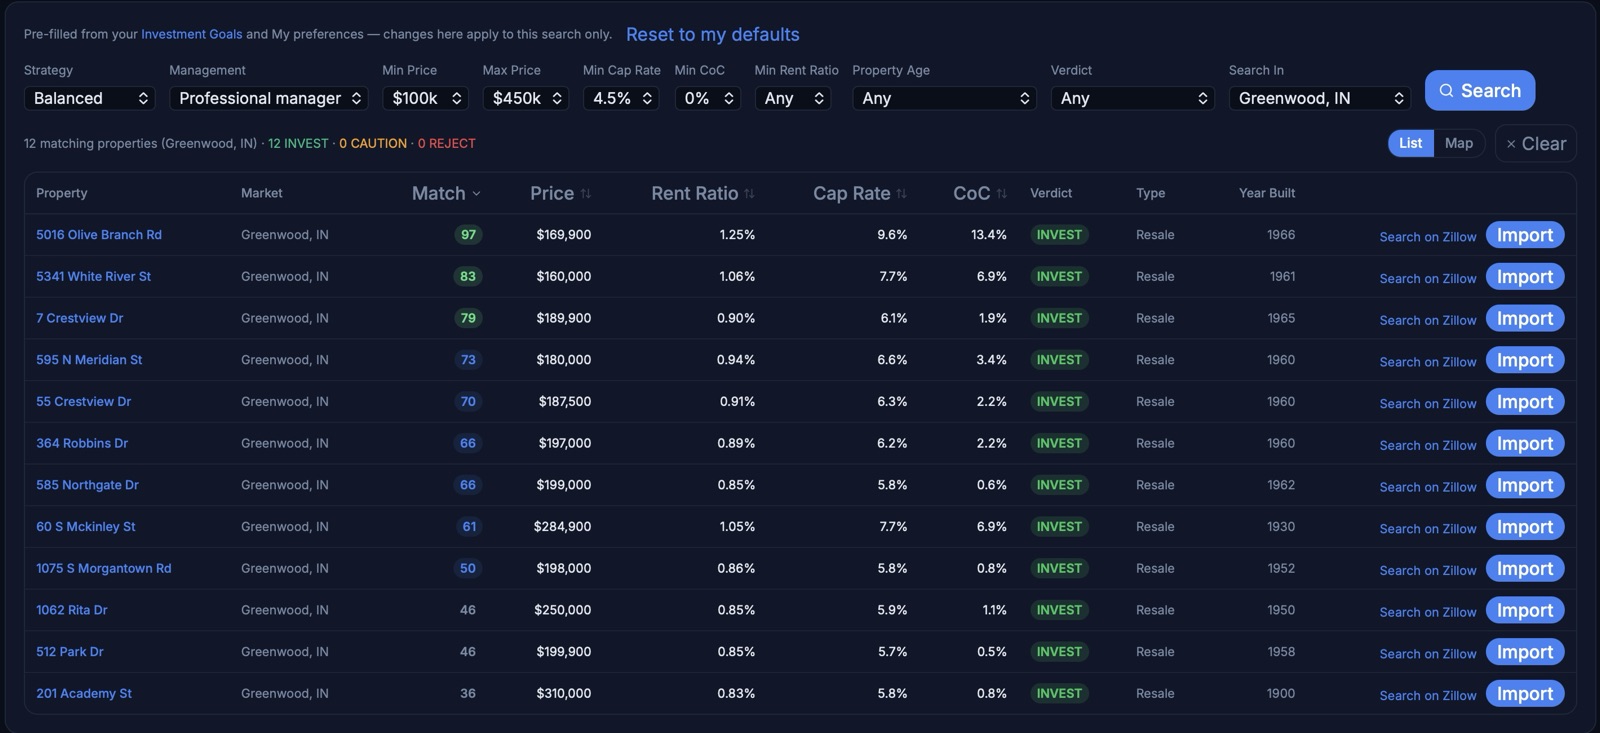
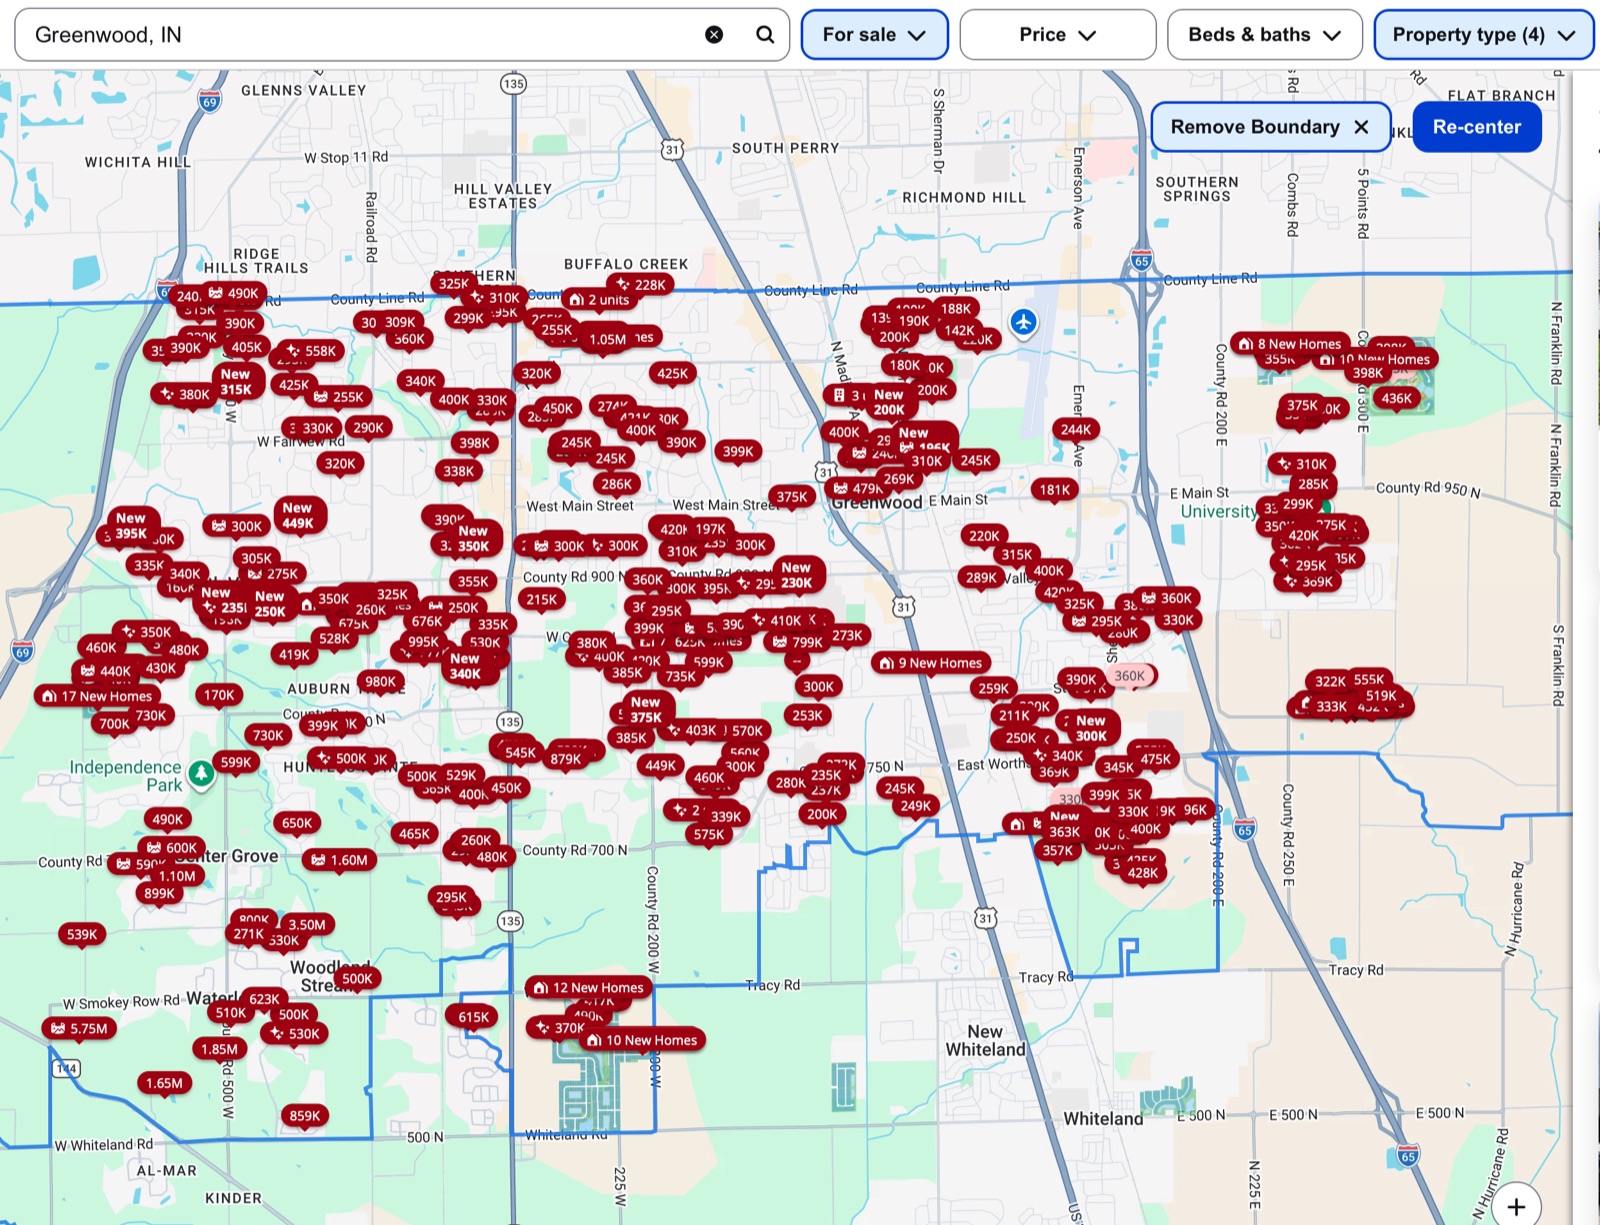
Search on your terms
Nationally, across your own markets, or one market at a time. Filter by price, cap rate, cash-on-cash return, rent ratio, property age, and verdict, pre-filled from your Investment Goals and adjustable per search.
Best-match ranking
Results are ranked for your strategy (cash flow, balanced, or appreciation) and management style (self-managed or professional), with INVEST properties first.
List or map
View results as a sortable list or a map. INVEST properties stand out as filled green pins; nearby properties merge into bubbles showing the count and verdict mix.
Market pages
Each market shows its available listings, best first, alongside your market research and a ranked-cities report for the metro.
One-click import
Import a listing into your portfolio with the same numbers and verdict you saw in search. If you haven't added that market yet, it's added for you.
Verdicts stay current
Change your goals, financing, or market assumptions and every property is re-evaluated automatically.
Realtor listings, side by side
Listings from realtors and the scanned database appear together in the same search, maps, and market pages.
-
Realtors upload directly
From a property PDF, a CSV, or an Excel spreadsheet exported from an MLS hot sheet. Each realtor listing shows the realtor's name.
-
Missing numbers filled in
A realtor listing without rent or insurance gets the same researched estimates as database listings, clearly marked as estimates, and isn't marked down for the missing figures.
-
Are you a realtor or builder?
Read the Listing Partner Agreement or get in touch about listing your properties.
Find the properties that meet your returns
Search the database, run the Fiduciary Filter, review 30-year projections, and import the properties you want into your portfolio, including inside a 1031 exchange window.
Rent and insurance figures are researched estimates, and listings are refreshed regularly. Confirm figures and availability before you buy.